Carl's Teaching Blog

A place to talk about teaching and learning

Category: Uncategorized (Page 11 of 19)

This Week: Spread Pretty Thin

There are a number of things on the calendar this week, including some exciting things, some programming for school that involves a lot of sitting in front of a computer, and apparently a burgeoning sore throat (ugh).

What I’m Teaching This Week

This week I am going to try to wrap up talking about the measures of center and start talking about the measures of spread. We talked about the IQR and outliers on the day before spring break, but I think I will need to review that since attendance was horrible on that day. I also want to talk about Standard Deviation, but I want to figure out how to get them to tell me what the formula should be. I’ll let you know how that goes.

What I’m Blogging This Week

One thing that I’m doing on the internet is giving a talk at the GLOBAL MATH DEPARTMENT!!! This talk, entitled “Teaching the Mathematical Practices Through Non-Routine Problems” is going to be the exact same 30 minute talk that I gave at NCTM a few weeks ago, with some time built in for doing some math. I’m pretty excited about it.

Hopefully I will be able to continue blogging about the #Shadowcon16 Calls To Action. So far I have talked about Robert Kaplinsky and Gail Burrill, which means that Kaneka Turner and Graham Fletcher would be the next two if I’m going in the order of the event, but I might also change it up and go with Rochelle Gutierrez or Brian Bushart, we’ll see what happens.

What I’m Thinking This Week

Yesterday one of the paraprofessionals at the school asked “what happened to you? You’re not happy anymore, where’s your smile?” I couldn’t really defend my self. It feels like I’m behind on a whole bunch of things at school, and I guess that takes it’s toll on your mood. As a person with a mood disorder, I am very aware of where I’m at, and it has been noticeably down since coming back from break. Sometimes your mood can be operating outside of the external or internal reality and not necessarily tied to that TPS report you need to file, or that thing that kid said. My first response is always to assume that it is on it’s way back around and to just have to ride it out. I get the feeling that in late June I will certainly be happier, so I’ll grind through for the next few weeks while looking for little moments to celebrate.

8/30
Searching For Fraud – Fun group data analysis activity for MMMR review

Yesterday I rolled out my Fraud Detection Activity. It was A LOT of set up to make it a year ago, but it is great to use for where my kids are now. At this point my kids need to transition from thinking about computing MMMR (Mean, Median, Mode, Range) to thinking about USING MMMR to solve bigger problems. It also sets up for a great conversation about outliers which is where I am going next! Let me break down the activity.

Searching For Fraud

Here is the opening paragraph:

After a recent scandal on wall street, bankers from around around have started making a number of suspicious transactions around the country, and we as a class have been asked to help figure out which information should be used to help find the culprits.

Our job is to look at all of the data and try to find transactions that are little higher, or a little lower than what would be considered normal. So the first thing you should do as an expert is to look at your data, and talk about which would be the most useful of the number strategies to use in this situation:

Students will have to look at sets of transactions to see if any of them appear to be different from the rest because they might be fraudulent. Each student is given a sheet with 11 numbers and can use the tools they have learned to guess which numbers seem suspicious. All of the sheets have one or two clear outliers, and some others that are murky, while the rest of the numbers cluster closely around the mean.

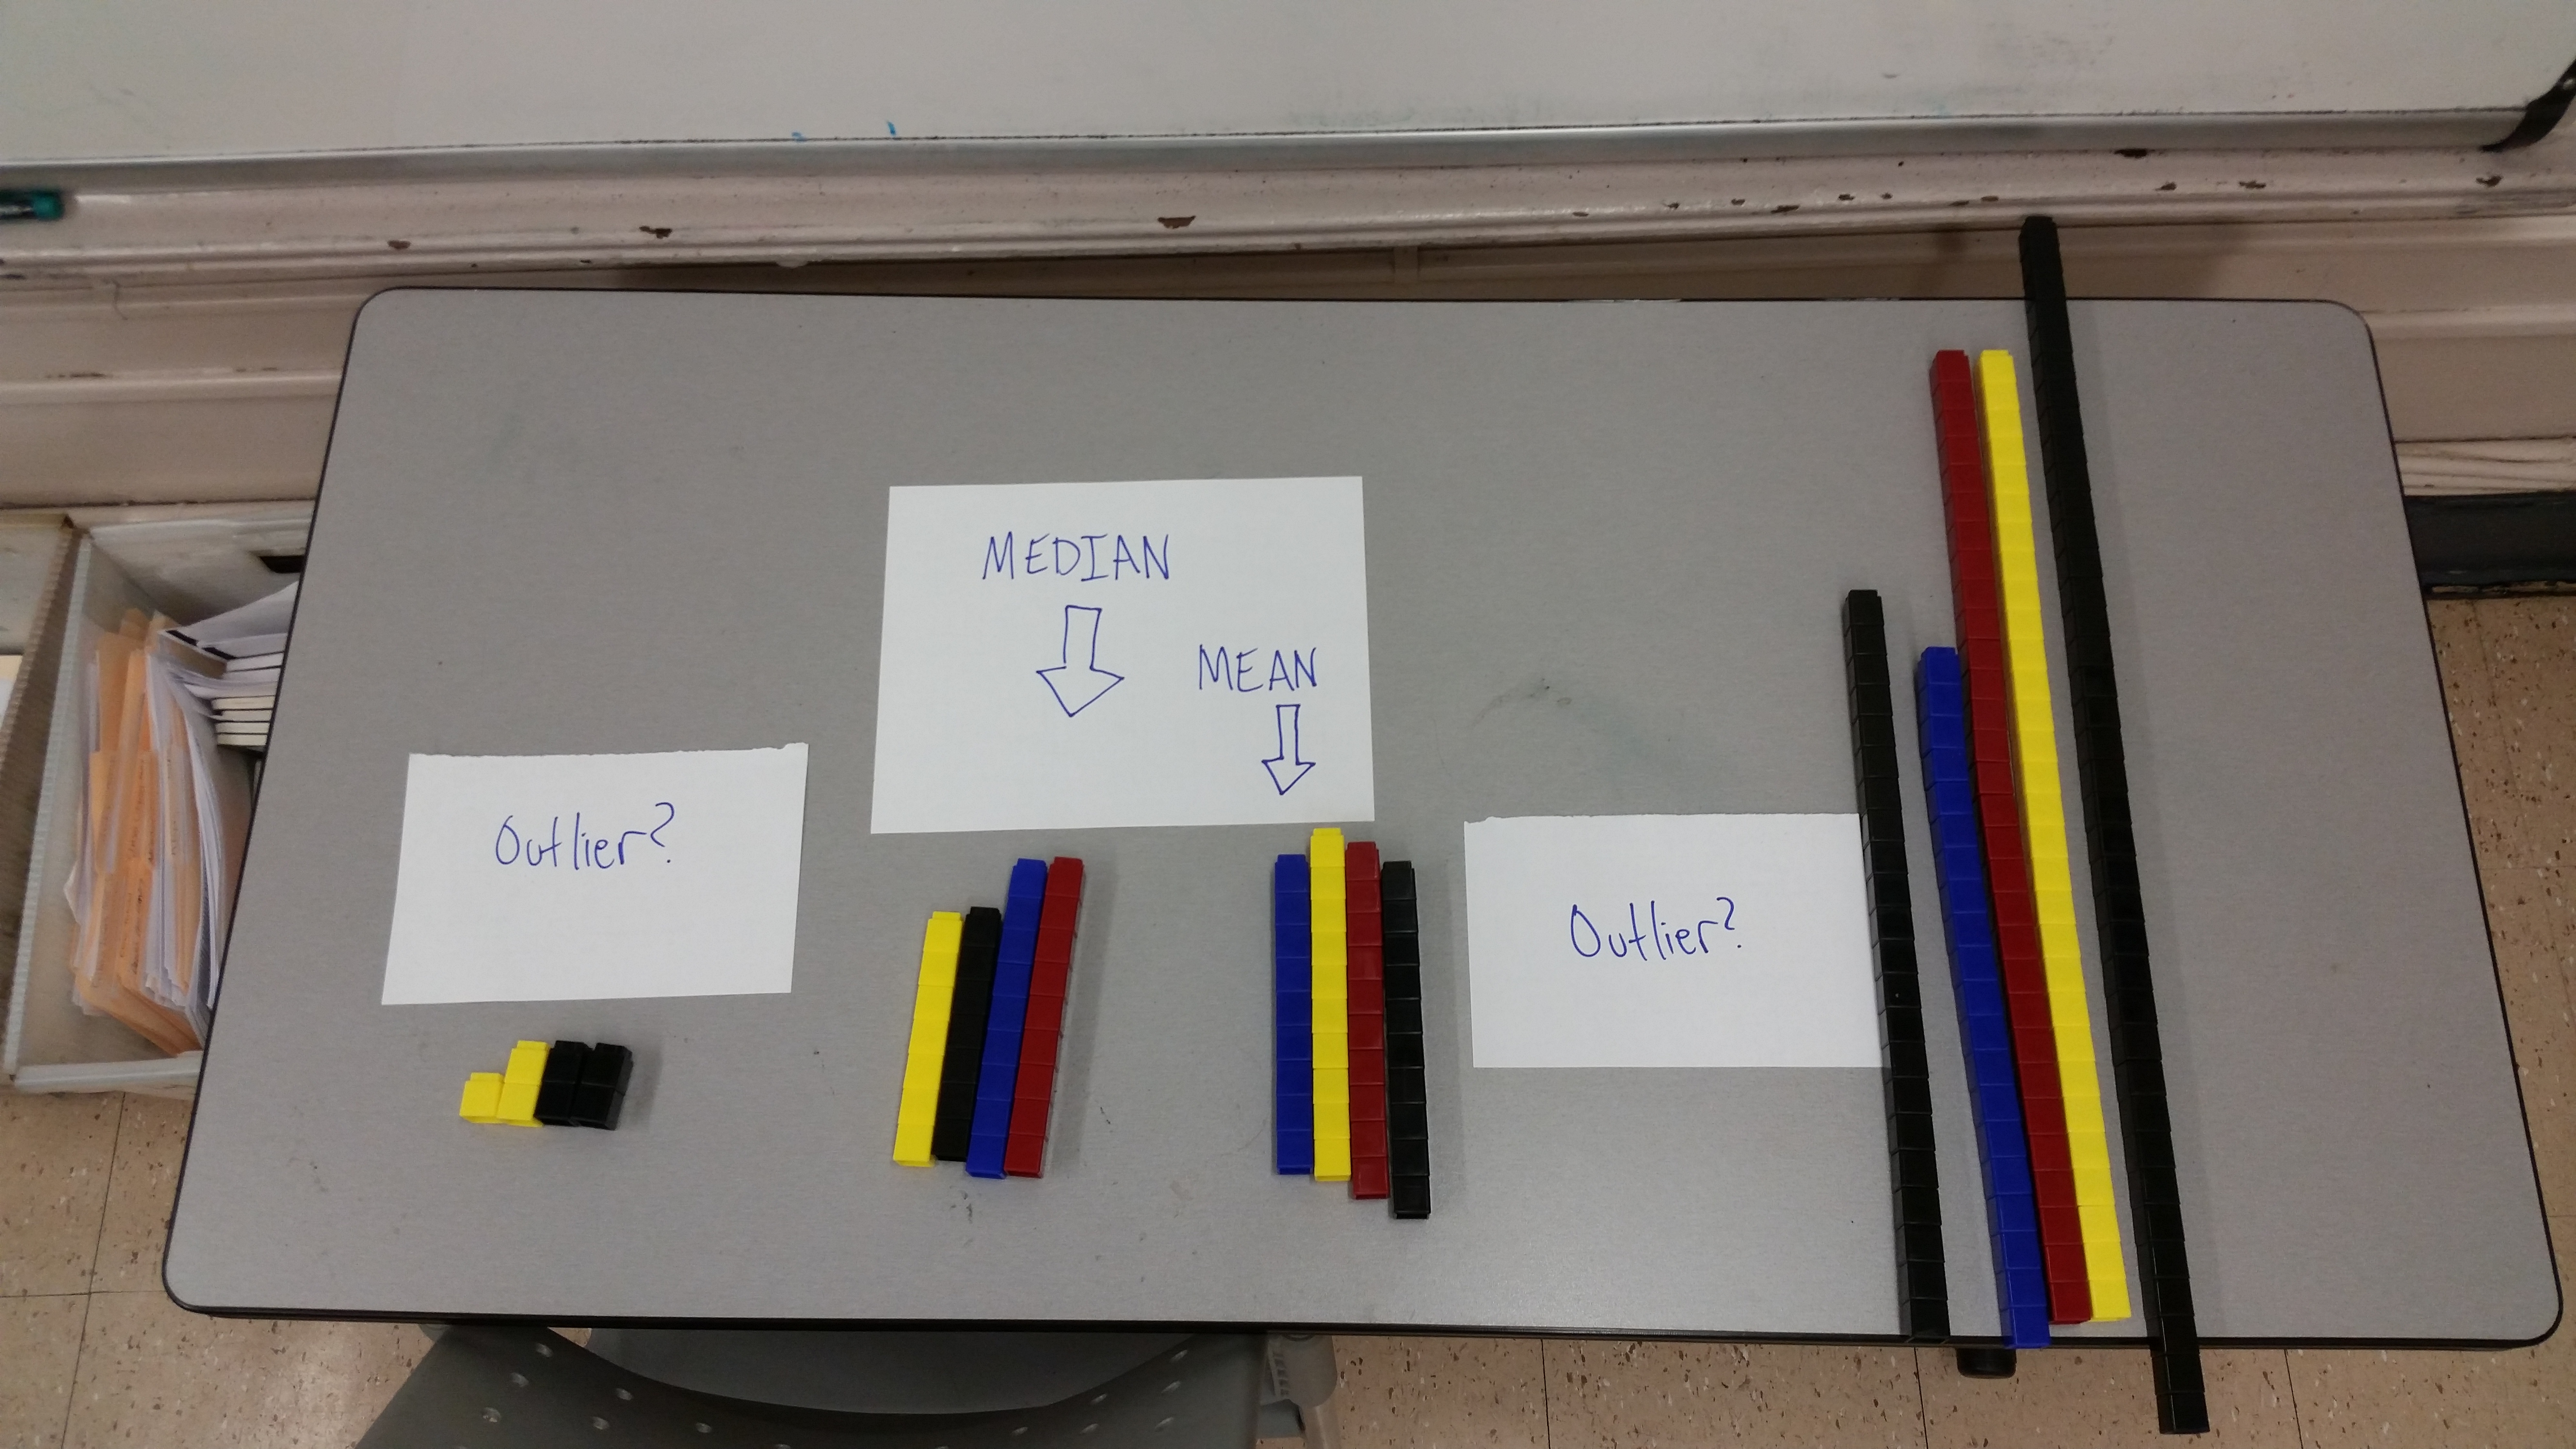
At the end of their individual work, the students are told to get in groups of three and compare all of the work and use that to refine the numbers they think are suspicious. Students know they need to do the work correctly, and since they all have different numbers, groups can’t just copy if someone has trouble computing. Since all the initial calculation has been done, the groups have to decide the best way to discuss and present all of their data and thinking on chart paper along with a visual representation of their data. Yesterday the four groups used Unifix cubes as a quick visual representation.

20160505_154822.jpg

The activity has a lot of good aspects to it, and a lot of things to improve.

Good things:

  • Students get to work independently, and in groups and the group work requires the students to depend on each other.
  • The groups hold the individuals accountable because they need each other’s information.
  • The kids get introduced to the difficulties around outliers, and the need for tools like the IQR or Standard deviation naturally.

Areas for improvement:

  • I should make some of the groups end up producing different numbers, so some of the groups’ outliers will be close to other groups’ median or average. This could get kids to want a method to compare the outliers from different sets of data.
  • I want to optimize the interface of the sheets so that kids understand the task better, and so that the group work is clearer and delineated.

If you’re interested in this, here is a google folder with the 18 different assignments, as well as the spreadsheet that I used the AutoCrat, the google sheets add-on, to generate each of the sheets.

6/30

This is my second post of the day since I slipped yesterday and forgot. My other post is here.

Teach Mathematical Practices through Non-Routine Problems – #NCTMannual

These are the slides from my presentation at NCTM San Francisco

Download (PDF, 1.28MB)

For the actual slides click here to download the powerpoint

For more problems check out my #probchat treasury

To talk about problems on twitter, check out #probchat, Sunday Nights at 9, starting out April 24th!

The #Probchat Treasury: Every Problem That’s Ever Been Chatted

In February of 2015 a twitter conversation led to the creation of #probchat, a twitter chat about solving problems. Each week we would talk about a different problem and how students may approach it. The problems each week came from different sources around the internet in order to demonstrate the vast array of interesting problems available across the web. It was a bit of a struggle finding problems each week, but I think I was able to find a collection of problems with a number of good characteristics. It seemed like it would be a good idea to have all of those problems referenced on the web, so this post.

#probchat Problem Characteristics

Each problem was one I found somewhere on the internet (except for Basketball Practice). After looking at all of them, it seems that the problems I settled on each week had the following characteristics:

  • Required little more than elementary math knowledge
  • Even people with advanced math knowledge would not find any immediate and obvious solution strategies
  • Had a realistic context or story which inspired a genuine desire for a mathematical solution
  • Had a context or story simple enough to be easily read on twitter
  • Could be approached with different problem solving strategies

Is This The End?

For now #probchat is on hiatus. Having a new job and a new baby has made it hard to have free time in the evenings, and the slowchats that I tried in November never really seemed to get much traction. After the NCTM conference in San Francisco I may see if I can give it the time it deserves, or see if I can develop a format that garners interest and isn’t demanding. If you have any ideas about how it could successful again, let me know in the comments!

Read More

Results Of My Search For Good Quadratic Tasks

A few weeks ago I tweeted this:

This post will list a few of the interesting trends and what I ended up using with my class.

Perimeter-Area Tasks

The first assignments we did in the class revolved around the kids observing and talking about the patterns that they could see in visual patterns, and some instructional activities. These usually involve seeing some shape change as it grows from one iteration to the next.

Variables start appearing once students see that there are parts of the pattern that add on more shapes and use Length x Width, or the corresponding area formula, to make some kind of equation.

There are also area tasks that involve fixing dimensions, and then finding the area. Here’s an example from NRICH. If you give students a certain amount of fence and ask them to find the dimensions of the largest rectangle, or even other shapes, then result will be a quadratic function. The resulting function compares the variable x representing one changing side, to the area of the shape.

Changing-Rate tasks

Another type of tasks could involve changing rates, by that I mean a rate that is constantly changing. One relationship that was suggested via twitter was that ‘price x quanity = revenue’. So like if kids have a price, and then quantity is allowed to vary, then they could make a linear function to find the revenue based on the price. Well sure Carl, but how could that be a quadratic when you just showed it’s linear?” Well, what if the price depended on quantity as well? This is actually a real phenomenon, as the price of products typically go down as producers try to get you to buy more products. Then students would first have an equation that would make sense for price.

I made a task based around this principle that was talking about the ‘pay rate x hours = paycheck’ relationships for my old college job. As a dishwasher I was paid in both a constant, hourly rate, and a changing “tip share” that was handed out in increasing increments as I worked more hours. This meant that the worksheet shows a dishwasher with a pay rate that changes! It’s a pretty interesting situation to explore. Click below to see this task which both looks at the linear function for the pay rate after each hour, and also the quadratic function for total pay after working a number of hours.

Download (DOCX, 1.29MB)

I brought this up again in my final project, where kids make a cereal (This one will hopefully gets finished soon, and I will post it then). In my cereal project, I told kids they were going to design a $6.00 box of cereal, it could have a price that had to lower the price by half a penny everytime they wanted to produce more. So they have an equation for the price per box of 6 – .005Q = P. They and can make a revenue equation by multiplying price by quantity like before (6-.005Q)Q = R.

Projectile Motion Tasks

There a bunch of tasks where the kids are given an equation that models certain types of scenarios, and then they have to apply it to a specific situation. This could be using a graphing calculator to find the coefficients of a function that models a projectiles motion. This could be charting some real or recorded scenario where kids have to model the flight of balls, or catapult launched stuff, maybe even cornhole beanbags. At the end kids find the coefficients for an equation that uses the position vertically and horizontally. It’s also possible to find tasks that look at the relationship between time and height.

My Dream Task

In my mind I have a dream quadratics task that I wish existed but I wasn’t able to find it or figure it out. My dream task would be one where students come up with two linear equations related to the same context and then multiply them to find a new quadratic equation that makes sense in the context. This would mean they could draw all the graphs and see that for any x, they can look up and see the y-value from the two linear equations, and see the resulting product lying on the graph of the quadratic function. It seems like it could result in a whole bunch of connection-making and good mathematical discourse.

Have you seen a task like that before? Or any other good tasks? Let me know in the comments!

Page 11 of 19

Powered by WordPress & Theme by Anders Norén