
Yesterday I rolled out my Fraud Detection Activity. It was A LOT of set up to make it a year ago, but it is great to use for where my kids are now. At this point my kids need to transition from thinking about computing MMMR (Mean, Median, Mode, Range) to thinking about USING MMMR to solve bigger problems. It also sets up for a great conversation about outliers which is where I am going next! Let me break down the activity.
Searching For Fraud
Here is the opening paragraph:
After a recent scandal on wall street, bankers from around around have started making a number of suspicious transactions around the country, and we as a class have been asked to help figure out which information should be used to help find the culprits.
Our job is to look at all of the data and try to find transactions that are little higher, or a little lower than what would be considered normal. So the first thing you should do as an expert is to look at your data, and talk about which would be the most useful of the number strategies to use in this situation:
Students will have to look at sets of transactions to see if any of them appear to be different from the rest because they might be fraudulent. Each student is given a sheet with 11 numbers and can use the tools they have learned to guess which numbers seem suspicious. All of the sheets have one or two clear outliers, and some others that are murky, while the rest of the numbers cluster closely around the mean.
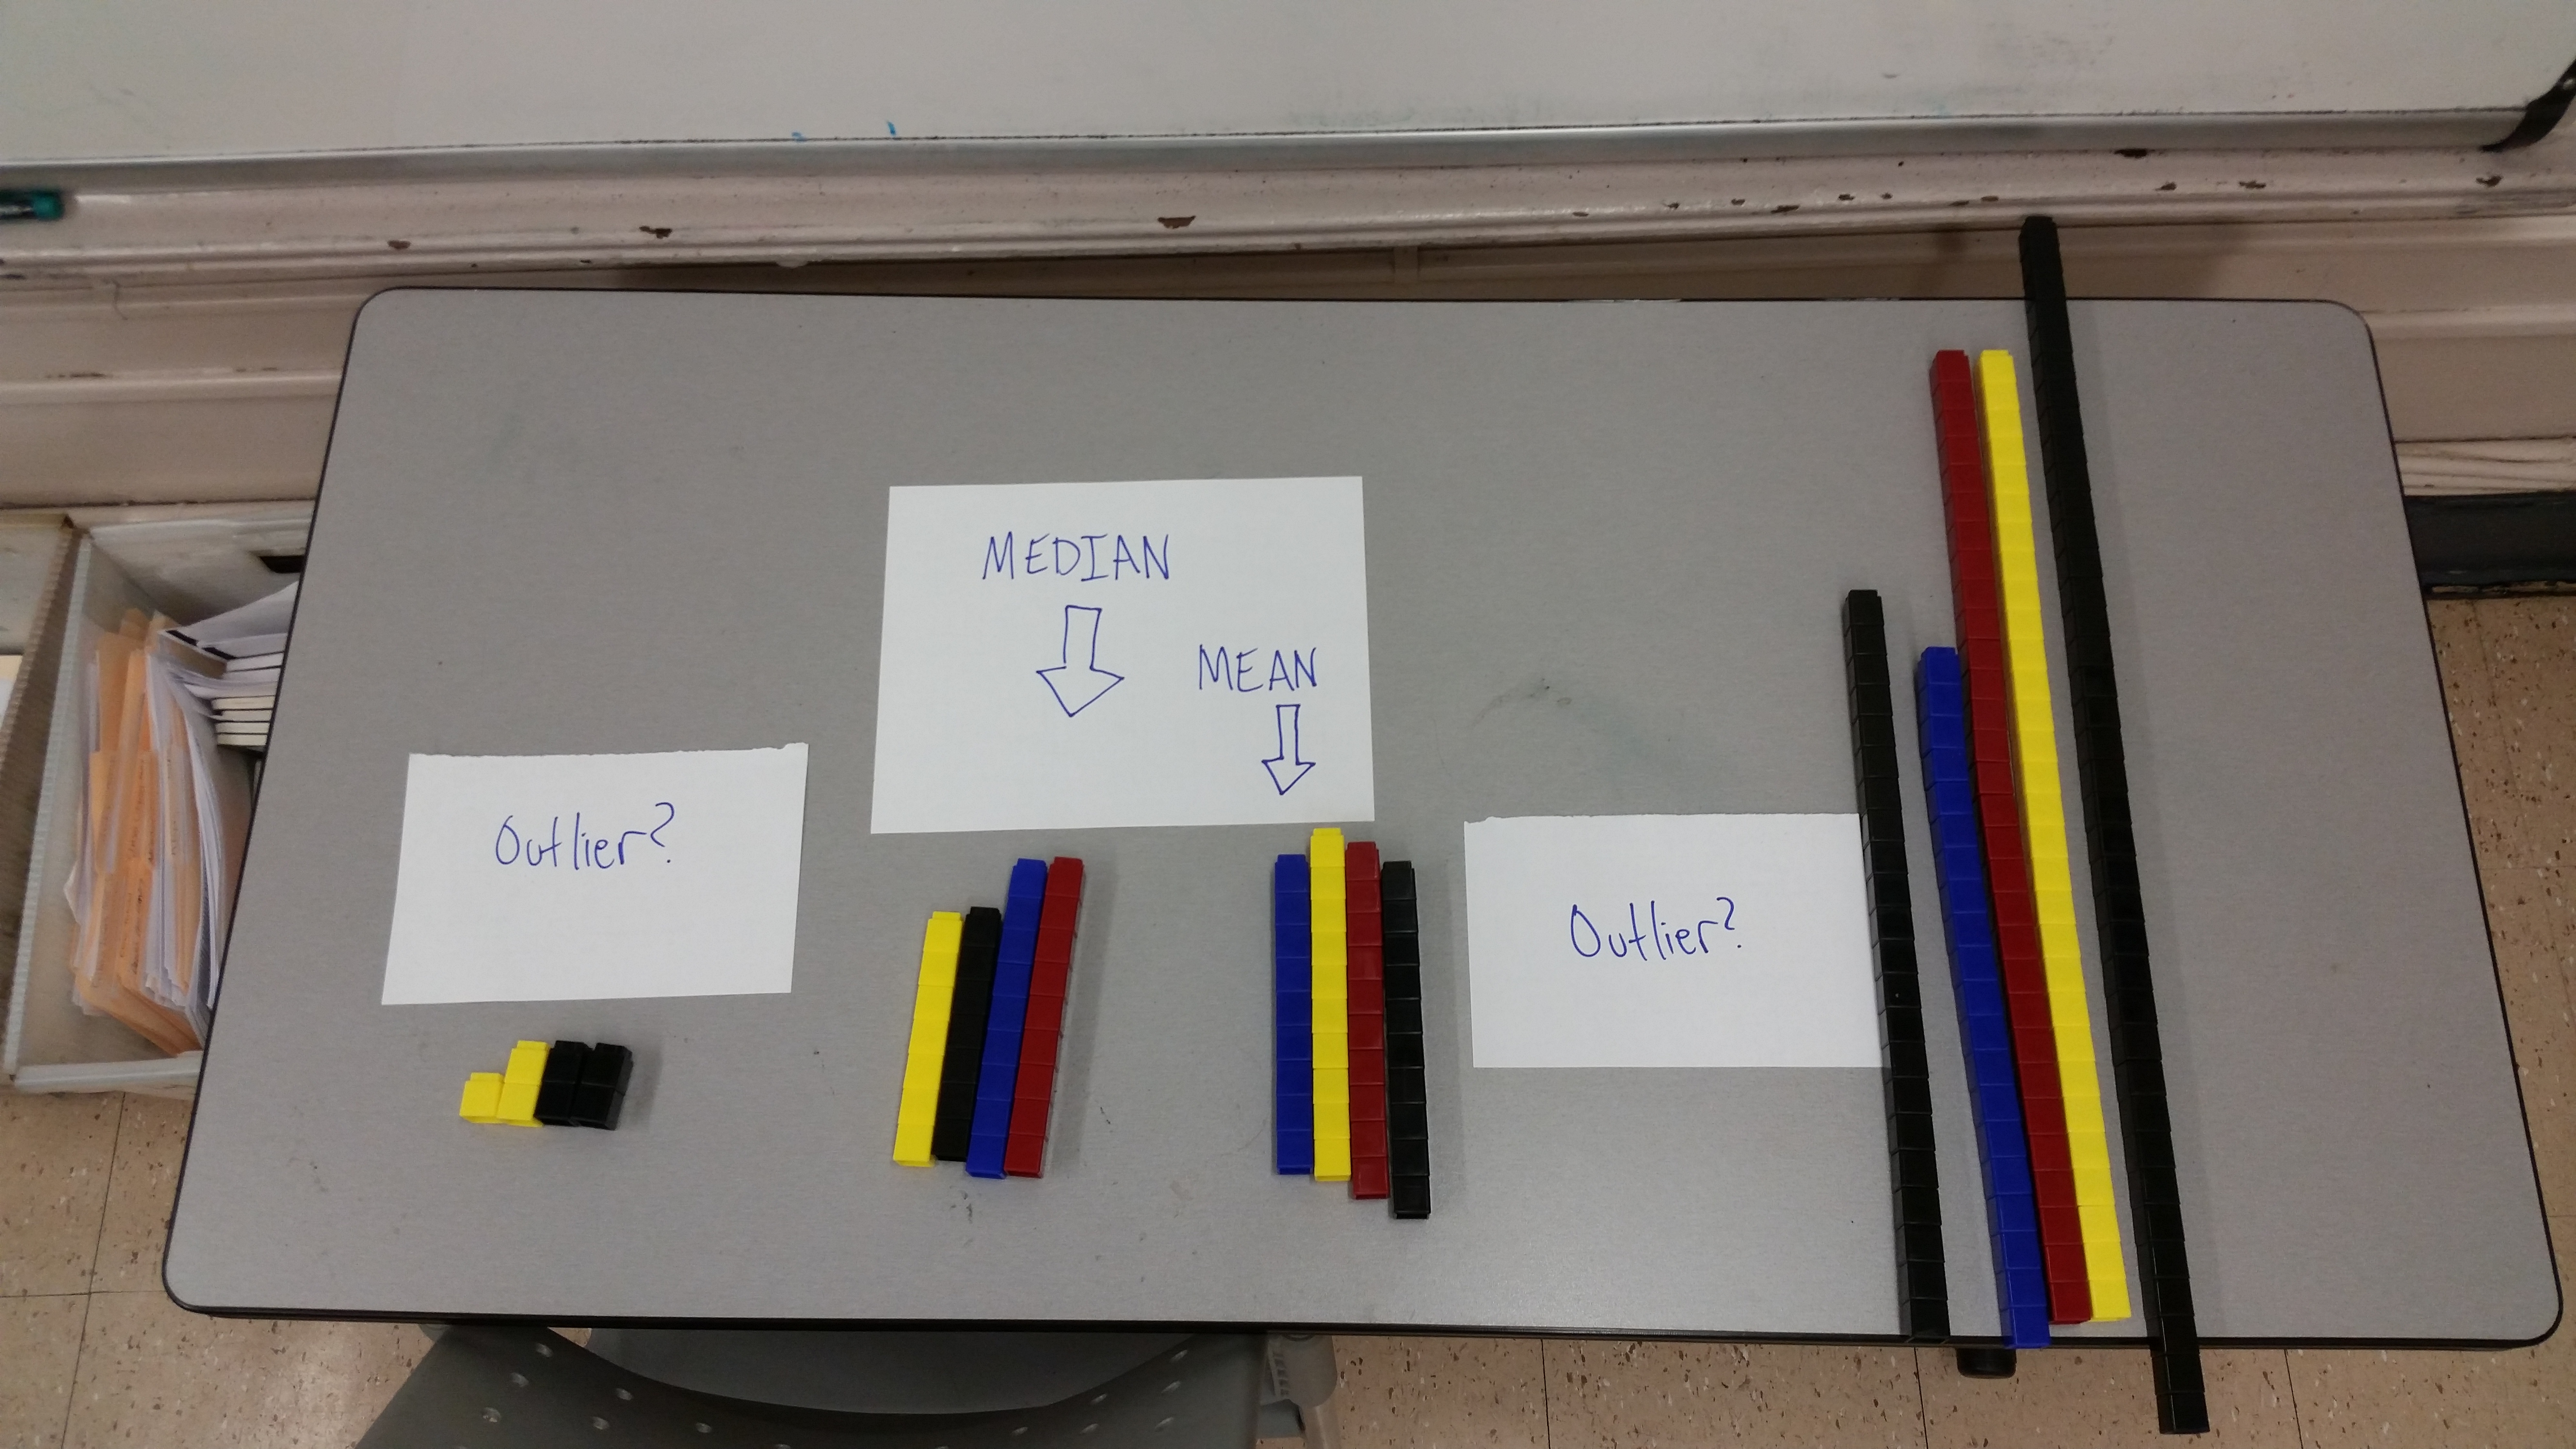
At the end of their individual work, the students are told to get in groups of three and compare all of the work and use that to refine the numbers they think are suspicious. Students know they need to do the work correctly, and since they all have different numbers, groups can’t just copy if someone has trouble computing. Since all the initial calculation has been done, the groups have to decide the best way to discuss and present all of their data and thinking on chart paper along with a visual representation of their data. Yesterday the four groups used Unifix cubes as a quick visual representation.
The activity has a lot of good aspects to it, and a lot of things to improve.
Good things:
- Students get to work independently, and in groups and the group work requires the students to depend on each other.
- The groups hold the individuals accountable because they need each other’s information.
- The kids get introduced to the difficulties around outliers, and the need for tools like the IQR or Standard deviation naturally.
Areas for improvement:
- I should make some of the groups end up producing different numbers, so some of the groups’ outliers will be close to other groups’ median or average. This could get kids to want a method to compare the outliers from different sets of data.
- I want to optimize the interface of the sheets so that kids understand the task better, and so that the group work is clearer and delineated.
If you’re interested in this, here is a google folder with the 18 different assignments, as well as the spreadsheet that I used the AutoCrat, the google sheets add-on, to generate each of the sheets.
6/30
This is my second post of the day since I slipped yesterday and forgot. My other post is here.
Leave a Reply