Carl's Teaching Blog

A place to talk about teaching and learning

Page 22 of 40

Results Of My Search For Good Quadratic Tasks

A few weeks ago I tweeted this:

This post will list a few of the interesting trends and what I ended up using with my class.

Perimeter-Area Tasks

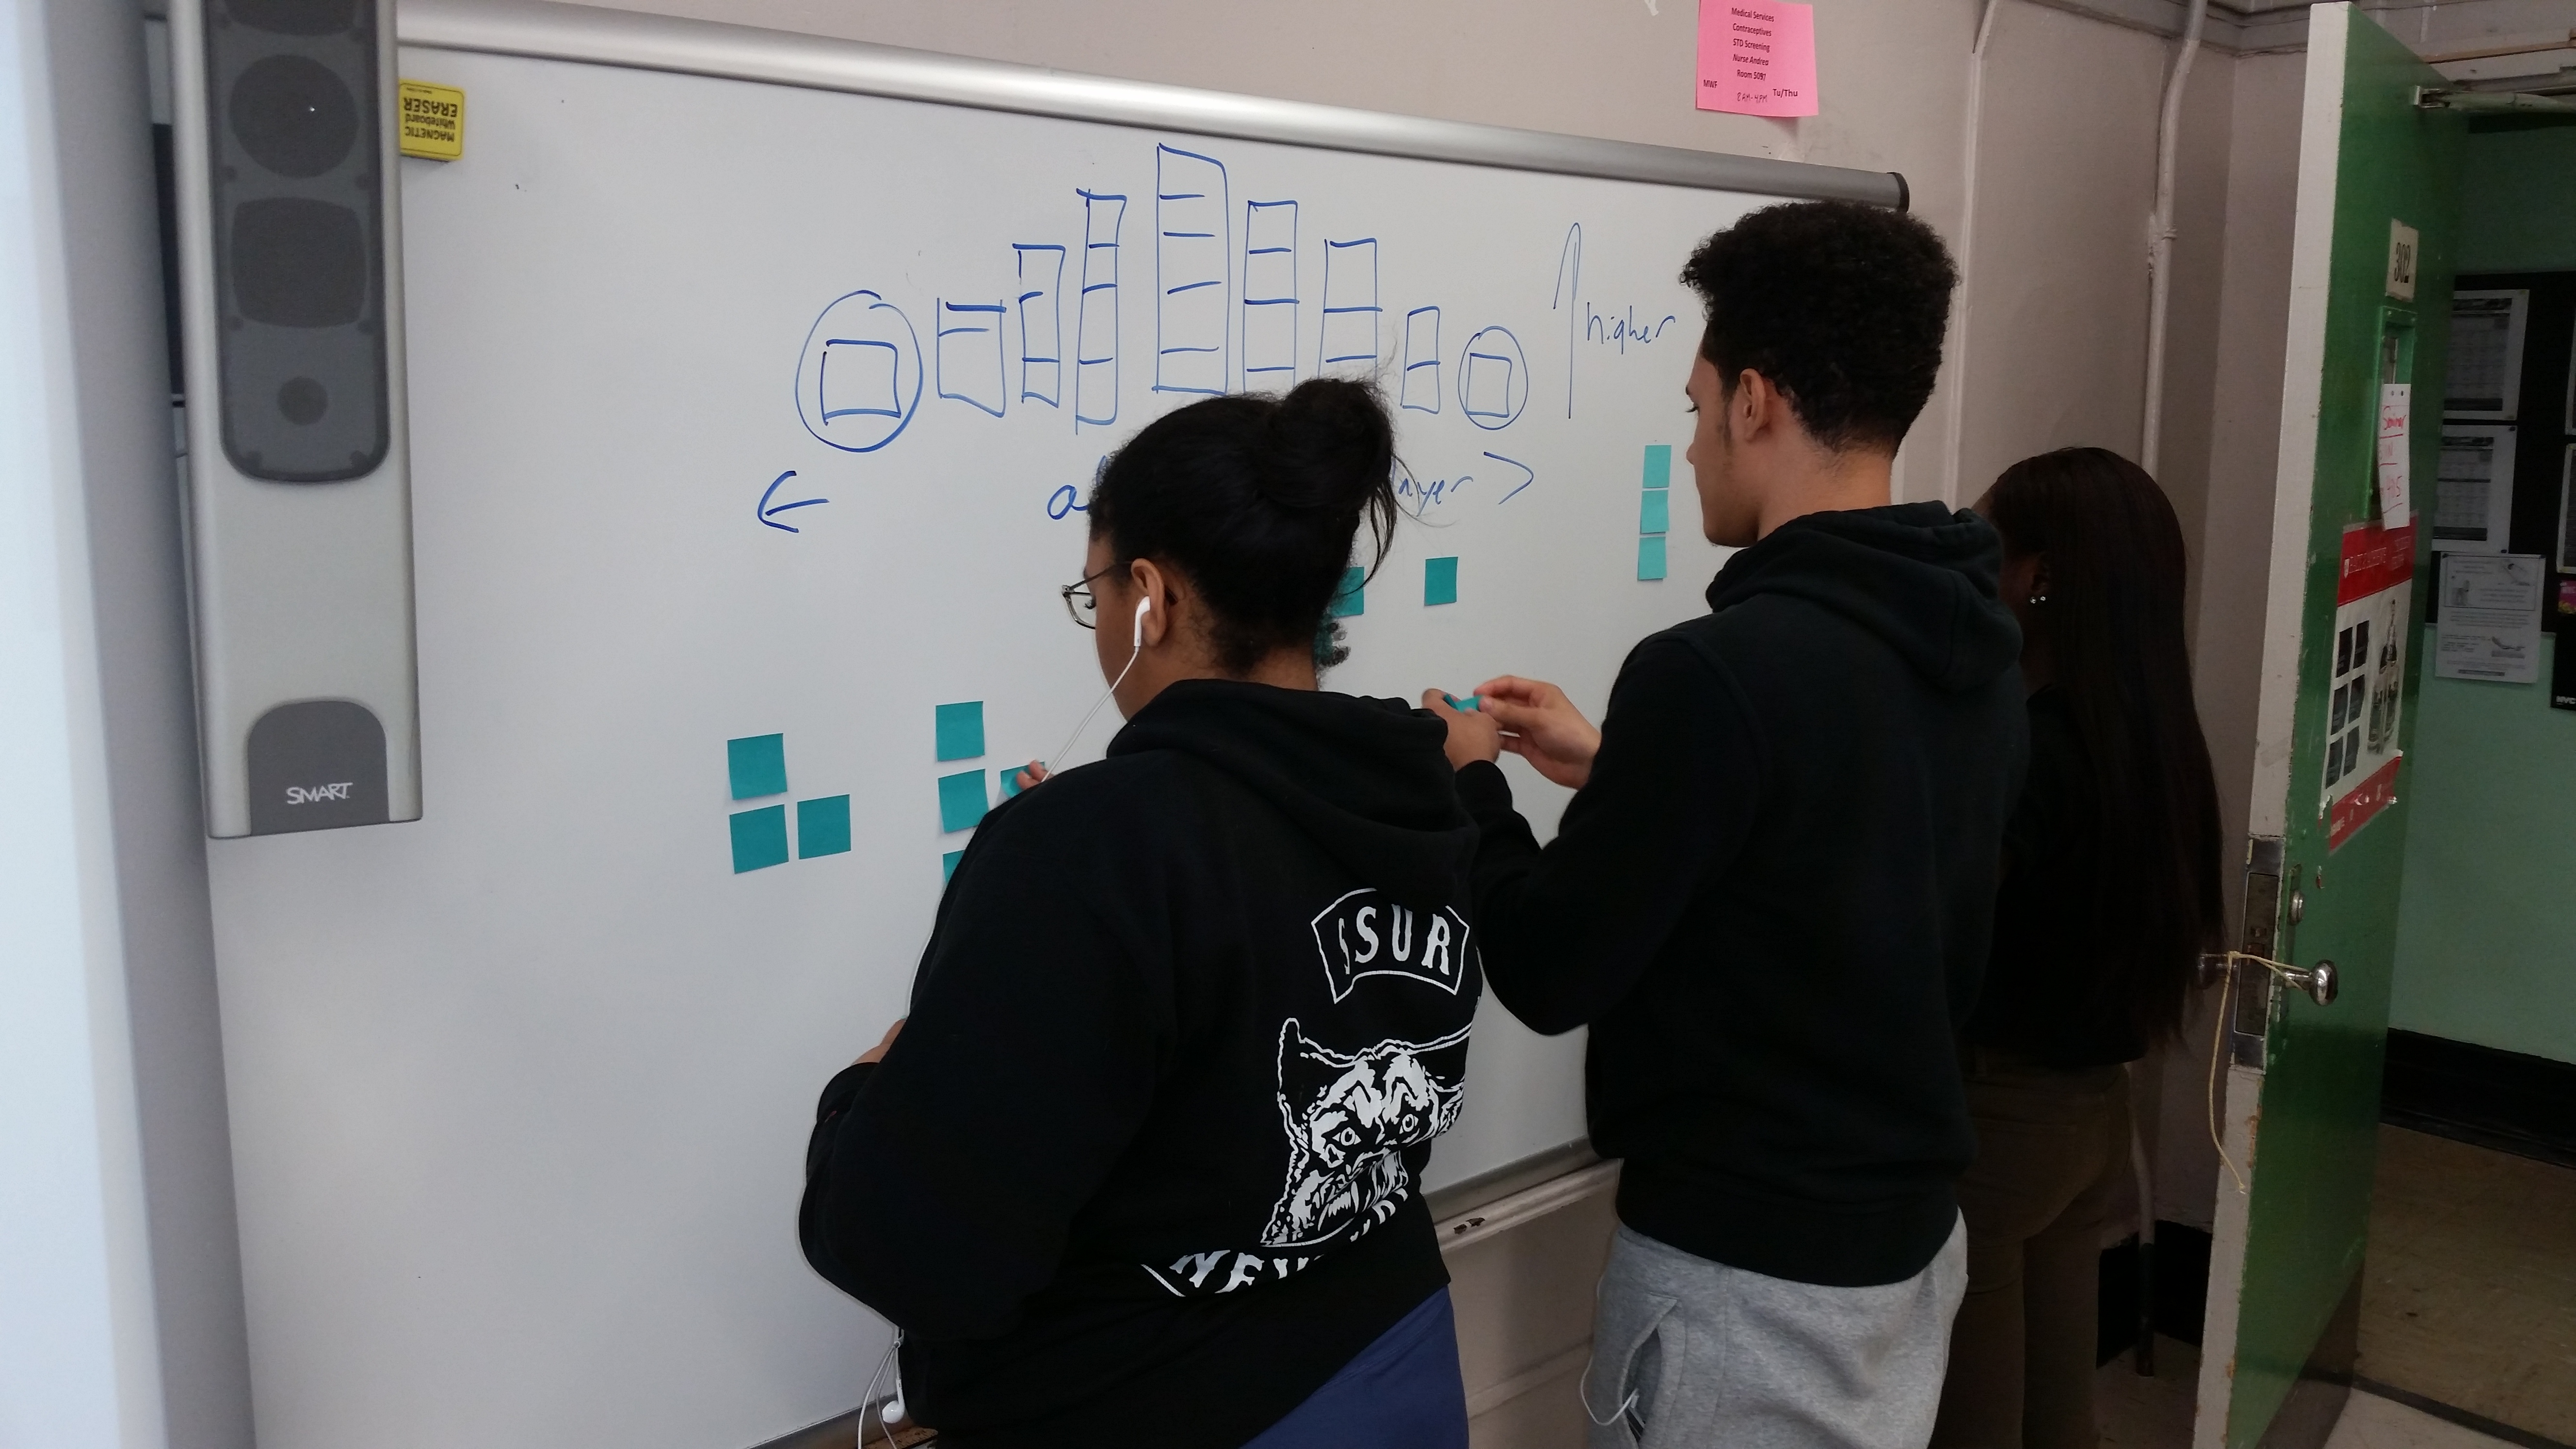
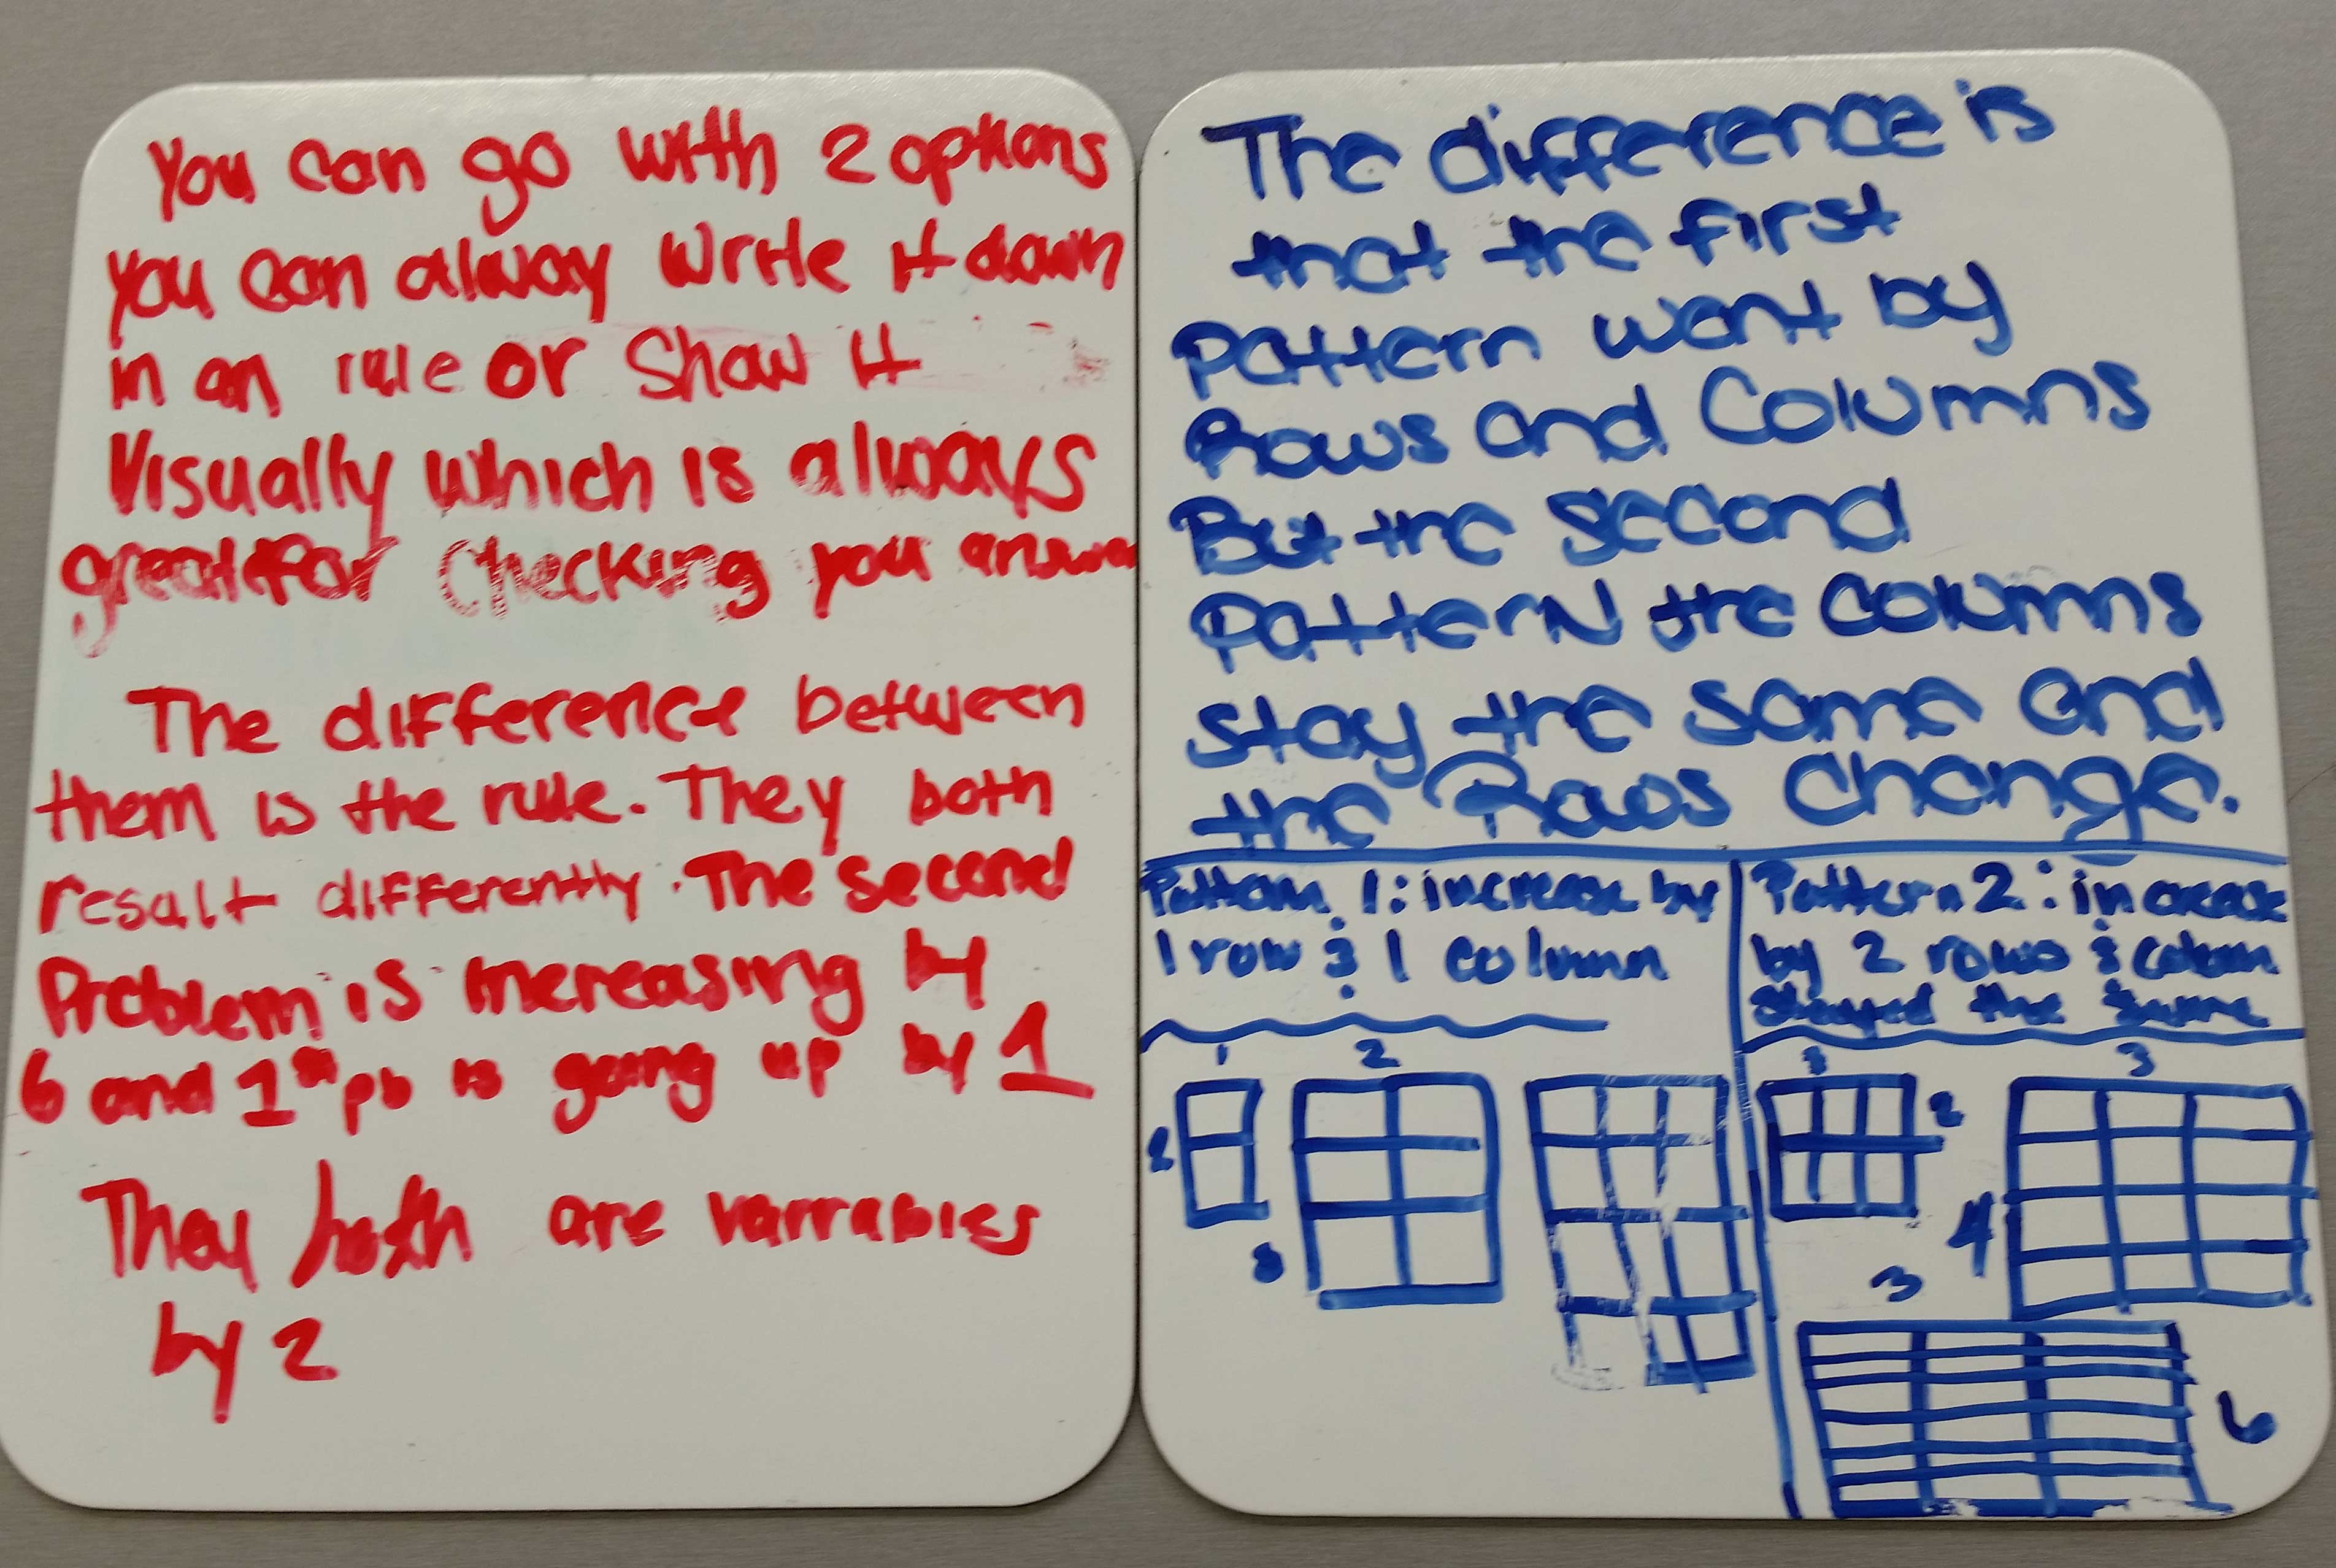
The first assignments we did in the class revolved around the kids observing and talking about the patterns that they could see in visual patterns, and some instructional activities. These usually involve seeing some shape change as it grows from one iteration to the next.

Variables start appearing once students see that there are parts of the pattern that add on more shapes and use Length x Width, or the corresponding area formula, to make some kind of equation.

There are also area tasks that involve fixing dimensions, and then finding the area. Here’s an example from NRICH. If you give students a certain amount of fence and ask them to find the dimensions of the largest rectangle, or even other shapes, then result will be a quadratic function. The resulting function compares the variable x representing one changing side, to the area of the shape.

Changing-Rate tasks

Another type of tasks could involve changing rates, by that I mean a rate that is constantly changing. One relationship that was suggested via twitter was that ‘price x quanity = revenue’. So like if kids have a price, and then quantity is allowed to vary, then they could make a linear function to find the revenue based on the price. Well sure Carl, but how could that be a quadratic when you just showed it’s linear?” Well, what if the price depended on quantity as well? This is actually a real phenomenon, as the price of products typically go down as producers try to get you to buy more products. Then students would first have an equation that would make sense for price.

I made a task based around this principle that was talking about the ‘pay rate x hours = paycheck’ relationships for my old college job. As a dishwasher I was paid in both a constant, hourly rate, and a changing “tip share” that was handed out in increasing increments as I worked more hours. This meant that the worksheet shows a dishwasher with a pay rate that changes! It’s a pretty interesting situation to explore. Click below to see this task which both looks at the linear function for the pay rate after each hour, and also the quadratic function for total pay after working a number of hours.

Download (DOCX, 1.29MB)

I brought this up again in my final project, where kids make a cereal (This one will hopefully gets finished soon, and I will post it then). In my cereal project, I told kids they were going to design a $6.00 box of cereal, it could have a price that had to lower the price by half a penny everytime they wanted to produce more. So they have an equation for the price per box of 6 – .005Q = P. They and can make a revenue equation by multiplying price by quantity like before (6-.005Q)Q = R.

Projectile Motion Tasks

There a bunch of tasks where the kids are given an equation that models certain types of scenarios, and then they have to apply it to a specific situation. This could be using a graphing calculator to find the coefficients of a function that models a projectiles motion. This could be charting some real or recorded scenario where kids have to model the flight of balls, or catapult launched stuff, maybe even cornhole beanbags. At the end kids find the coefficients for an equation that uses the position vertically and horizontally. It’s also possible to find tasks that look at the relationship between time and height.

My Dream Task

In my mind I have a dream quadratics task that I wish existed but I wasn’t able to find it or figure it out. My dream task would be one where students come up with two linear equations related to the same context and then multiply them to find a new quadratic equation that makes sense in the context. This would mean they could draw all the graphs and see that for any x, they can look up and see the y-value from the two linear equations, and see the resulting product lying on the graph of the quadratic function. It seems like it could result in a whole bunch of connection-making and good mathematical discourse.

Have you seen a task like that before? Or any other good tasks? Let me know in the comments!

CLOG: Moving towards symbolic representation

We have spent our time this past few weeks turning an interest in patterns into an interest in modeling. Each day we have done activities to get the students to think about number sense, and also about relationships and functions. Next we will focus on linear and quadratics simultaneously and look at both as examples of functions that we can use to describe how things grow and change. Teaching the two functions simultaneously will hopefully strengthen kids’ understanding of what functions are and what they could be more so than focusing immediately and solely on linear.

I taught my class twice, as per usual. The way our school is scheduled, we only see kids on Tuesdays-Thursday classes for 90 minutes each. The class has only met on 6 occasions (and one of those was taught by a sub who wasn’t given my subplans). At times it feels like we should be further along, but I want to remember to be patient.

Tuesday we looked at the penny circle on Desmos. We also opened up class with three visual patterns, one linear, one quadratic, and one exponential followed by a Contemplate then Calculate activity from math.newvisions.org. This helped going into the penny circle because they were familiar with the types of equations, and also with counting things. The best part about Desmos activities are that it let’s the students work independently on tasks, and learn from each other. It is certainly because of these benefits that the universe conjured up a perfect storm of misplaced computer cart key and a soft lockdown drill kept me from actually using computers with my kids, and I ended up having a few kids walk through it with the smart board. Luckily I made a worksheet so I could see what kids are thinking about the activity, and the kids could still engage in this whole-class format. The students were able to see how the different equations look on a coordinate graph.

Following the activity we did an Interpreting Distance Time Graphs from the Shell Centre, which we did not have time to finish.

On Thursday we started with a visual pattern that worked out pretty well. This was the 5th one of these that I have done, but it was the first time I asked for symbolic equations for the patterns. I was surprised that students didn’t offer some kind of equation earlier, but I still wanted to wait until this point because we could start working with equations soon. To formally begin working with equations we looked at a modified version of Tina’s quilt squares, which has been a staple of my introduction to quadratics for years. Kids then worked on finding the number of grey squares and the number of white squares and eventually we had time to talk about the equations.

Clog: Getting ready for the next Episode

Today we finished up the first little “Episode” of my class, the goal of which was to  be able to identify relationships and functions as well as expose them to the terms ‘linear’ and ‘quadratic’ to describe their work with visual patterns. We had finished 8 different kinds of patterns by the time this class rolled around, including this one from youcubed. Since are now experts, I asked them to create their own patterns of blocks and put them on the board using Post-It notes, sort of a play on VNPS. Later on they were able to classify the patterns that they made as either Linear or Quadratic once they learned that that is a word used in math. The majority of the patterns they created were linear, which left me wondering if I should have exposed them to more non-linear patterns or if I just have a linear bunch of students.

20160225_131951.jpg

Following this activity the students worked on a little reflection to wrap up this first Episode. I had this idea of breaking my class into little Episodes over winter break while my wife and I shamelessly barreled our way through Agents of Shield and The Blacklist on Netflix. Surely, some of the structures that the writers use to draw viewers into their stories could be adopted by teachers as they plan their units. My plan is to have these clear distinct units at the end of which is a little reflection, it’s roughly the “big idea” from the last 4 classes. Since the “big ideas” are the characters in my 2nd period show, the end of the Episode should highlight a new piece of information about one of the “big ideas.” The reflection on these things will help students keep track of all the important connections and representations. As we start future classes I plan to use the students reflections as part of a little introduction. This introduction could be mirror the “In the last episode…” or “Previously on Agents of Shield” announcements they have on TV which are followed by replays of key scenes from the series. So on the days where the concepts from this Episode stand to make particularly strong connections the ideas from the next Episode, I will try to adopt that by bringing back some of the more interesting reflections that student wrote.

What is the next Episode going to be about? Understanding! Specifically, getting to different forms of linear and quadratic equations with lots of understanding. We can look at difference tables, and break apart the meaning of the y-intercept and other variables in the equations, as well as looking at how these things reflect in the graph. I will work in some instructional activities and some problem strings in addition to counting circles as a way to help kids build some number sense. Since today’s post-it notes were a success, it seems like I will have to use more manipulatives, and try some Vertical Non Permanent Surface Problem Solving. If you have any ideas of things I should try, or other ways to make my class as addictive as a Netflix bing, let me know in the comments!

CLOG: First Class Of The Cycle

This Tuesday was the first math class I was teaching all year. This means Monday night I was wringing out my twitter feed like wet dish rag, trying to squeeze out every drop of teaching ideas into my class the next day. The turnover and structure of our school means that every marking period gives teachers the first day of school ‘blank page’ feeling.

My first day of school for this quarter needed to have some routines to build number sense, promote discourse, and get the kids prepared for an exploration of quadratics that put procedural knowledge in the backseat.  I settled on starting Tuesday with a counting circle for 10 minutes each class.  Sadie’s post from a few years ago seemed to be within six-degrees of separation of any post you can find on counting circles, and it pretty much convinced me to start my first class with this routine. As the cycle goes on I may try to work in a Problem String or some other routine.The idea is to start class each day with everyone working together and talking, as opposed to my usual Do Now-Review.

I like to think of this class as a unit in quadratics that puts procedures on the back burner. To plant the seed for some discourse around the quadratics I asked to get in groups and have a little conversation about two different kinds of visual patterns and to talk in small groups about what similarities and differences they saw in the two patterns.  The worksheet I used is below, and was a lightly modified version of one from last year.

Download (PDF, 50KB)

The worksheet didn’t really help promote the group work the way I would have wanted, in part because the task could have been more group optimized, and I could have really pushed the kids to stick to the group roles I had prepared. But the biggest problem was that I had only 5 students who showed up to class. Low attendance is a regular occurrence at our school, but this was basically a tutoring session. I had the whole class sit around the same table and instead of using chart paper had each group just write on a mini-whiteboard and slide the result down to the group at the other end of the table.

The two groups worked differently, one visual, one comparing the differences, so it was good. I asked them to describe their work to each other. Then on their paper, paraphrase what they saw in the other approach and how it connects to their own work. It showed that I will need to work on helping students describe their thinking in order to let everyone be successful this cycle.

The last thing we did in the class was talk about functions, and for this I dusted off a tried and true function lesson. The thing that this assignment needs is to have more challenging problems for the students who are able to finish the work quickly. If I could have an “important stuff” section of future assignments, and then “tough stuff” or “fun stuff” sections and ask student just to work on whatever they think is worth their time I would probably be more successful. I would also be just that much closer to Bowen and Darryl, whose idea I would be stealing.

For a first class it was pretty good. I hope to keep posting here throughout the cycle. The next post will be a talk about what ended up happening when I had to miss the second class of the cycle because of a meeting I had to attend.

Banquet Tables: My Favorite Default Table Arrangement

So I’ve been trying to get on the blogging initiative, but I wasn’t really able to get everything together, so here is my second entry.

My school doesn’t assign classrooms to teachers. Each classroom is usually shared between a group of teachers, who all want to do different things with the room. This means if you want the room set up a certain way for your lesson, you usually have only the 5 minute passing period to make it happen. My favorite room configurations are ones that work well with our school’s room sharing.

I’ve had some success when I trained my kids to whip the desks into a different shape early in the period. When I shared the class with my colleague Marcus, the room was frequently in a U-shape. On the first day I trained students sitting in the ‘legs’, and ‘base’ of the U to drag their tables into small groups. I even taped labeled pieces of paper on the tables so kids knew which ones to push together. They became pretty good at getting them into position. I, on the other hand, was only average at remembering to ask them to put it back before the end of class, meaning I had to spend a lot of time after class getting the desks back in place for Marcus’s class.

My favorite arrangement for a classroom in is the “Banquet” table set up. This set up is favored by the 3 other math teachers in 302, so if you teach in that room, no moving desks! I call it the banquet table because the seats are all facing each other in two long columns from the front to the back of the room. No one’s back is to the board and kids can easily collaborate. If I’m in the central aisle, I can see what everyone is working on in one glance, and I have lots of space to pull a kid aside if needed. If I’m standing at the front of one table I can quickly get all of their attention. At the beginning of class when no one has their stuff out, I can slide their folders down the long table like an old-timey bartender.

This arrangement also really supports doing group work for our school. As a transfer school, our attendance is unpredictable, so this setting lets student naturally sit where they can work with neighbors. Typically when kids work in assigned groups there is always one group who has 2 or 3 kids missing or late each day.

Page 22 of 40

Powered by WordPress & Theme by Anders Norén