My Banking And Investment unit isn’t going to come to the epic conclusion as I once hoped, but life goes on. . Dunshire Abbey was my attempt to teach students all the fundamentals of economics through a classroom multiplayer game which could form the context of the final project. After talking with my colleagues and my students, I decided it would be too hard to finish this game. Instead I taught a brief lesson about the modern economic tenets (including inflation) to replace what we would have discovered during the game. Hopefully I will create a second version of the game that I can try with next years class.
The students in B&I now will finish the class at the helm of their own company operating in a perfectly competitive market, each with different conditions. Their assignment will be to use their knowledge to develop the costs associated with producing at 10 different levels and then determining their economic profit. The math embedded in this should be mixtures of some exciting patterns and developing functions along with some un-exciting algorithms, which I’ve not yet discovered how to avoid.
The assignment gave students the following as their task:
You have been given control of a company, Your Company is in the Industry of: (Name your Industry)
You ship giant units of product, at a price of ___________ per unit
Laborers in your industry get paid at a rate of ___________ Per Day
It takes ___________ Laborers to make ___________ Units of product
To make 1 unit of your product you need supplies which cost ___________
Decreasing Marginal Returns (Fee) affects you r company at a cost of ___________ * (quantity)^2
Also You have to pay 6000 for Rent, taxes, and other expenses.
You need to determine the costs for producing 1-10 units of your product.
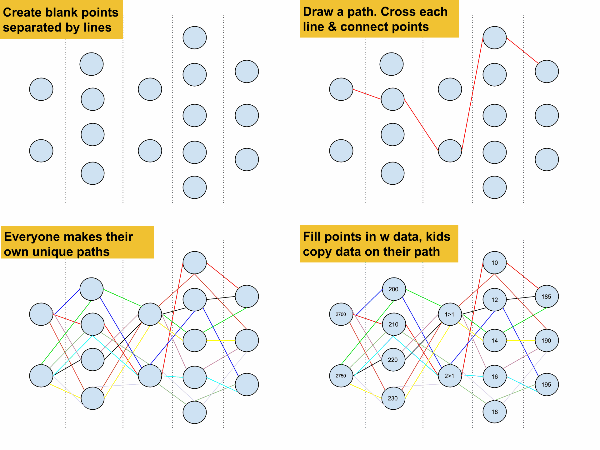
Going along with my principal of never accepting two identical projects, I needed the kids to have uniquely different companies. Since they hadn’t developed game information from the non-existent Dunshire Abbey game, I had to come up with new numbers, and I needed those numbers to “work.” After creating a pretty boss spreadsheet with a functioning set of numbers, I gave out functioning sets of numbers to students using the “Random Path” method. What’s the “Random Path” method? Good question!
The “Random Path” method is a way to get kids to select sets of data that otherwise would be handed out on little slips of paper. There are a set of points on the board that kids have to randomly draw paths through. The points get replaced with the different varieties of pre-selected data for each kid to copy down. It worked pretty well, but what do you think?
This class is interdisciplinary class is “math” and kids so far are getting what they expected. To do the first round of calculations the class spent a bunch of time working on a series of multiplication, addition, and subtraction problems to find 10 instances of their cost curves. The amount of rote calculating was discomfiting, and in the future this calculation may get done in the computer using spreadsheet formulas what are troubling in another way. It’s hard to decide the balance between having students use algorithms vs. using technology. In this case I feel that having a personal stake in each of the numbers in their tables will help students in the project so task asks for a lot of calculations by hand. By the end of class they had used their data to find their companies costs for 10 different quantities, as well as the revenue and profit. An example of the table is below:
| Quantity | Labor | Labor Cost | Rent | Fee | Supplies | Total Cost | Marginal cost | Average Cost |
| 1 | 2 | 420 | 6000 | 195 | 10 | 6625 | 1015 | 6625 |
| 2 | 4 | 840 | 6000 | 780 | 20 | 7640 | 1405 | 3820 |
| 3 | 6 | 1260 | 6000 | 1755 | 30 | 9045 | 1795 | 3015 |
| 4 | 8 | 1680 | 6000 | 3120 | 40 | 10840 | 2185 | 2710 |
| 5 | 10 | 2100 | 6000 | 4875 | 50 | 13025 | 2605 |
As kids finished these tables they started talking about patterns they saw in the various tables without prompting like “My total costs keep ending in 5 or 0, back and forth.” Seeing this made me feel better about all the calculation.
Merely finding where you make a profit isn’t as important in economics is making sure you know you have the exact most profit. To find the exact amount, students need to find the marginal cost which is essentially the first difference/derivative. I am excited about being able to sneak in a little calculus concept with this topic so we are going to talk about the marginal cost and use the equation to determine the exact point at which it equals average revenue (price). I am curious to see if kids can explain the relationship between the first difference and the original equation.
Does this make sense? Let me know if you have any questions or suggestions for next steps.


Leave a Reply